Arctic Landscape EXplorer (ALEX)
Discover land surface changes, hot spots of disturbance, and potential areas of active permafrost thaw and erosion. We have used remote sensing time series to detect and map permafrost disturbances at high spatial resolution throughout the entire Arctic region. Explore our story maps to learn about processes such as thermokarst and shore erosion.
Arctic land surface changes at a glance
Our map allows you to explore extraordinary changes in the Arctic land surface! Clicking on the pre-selected locations will guide you to some of the most spectacular, highly dynamic landscapes. Additional contextual information helps you interpret what you see and why.
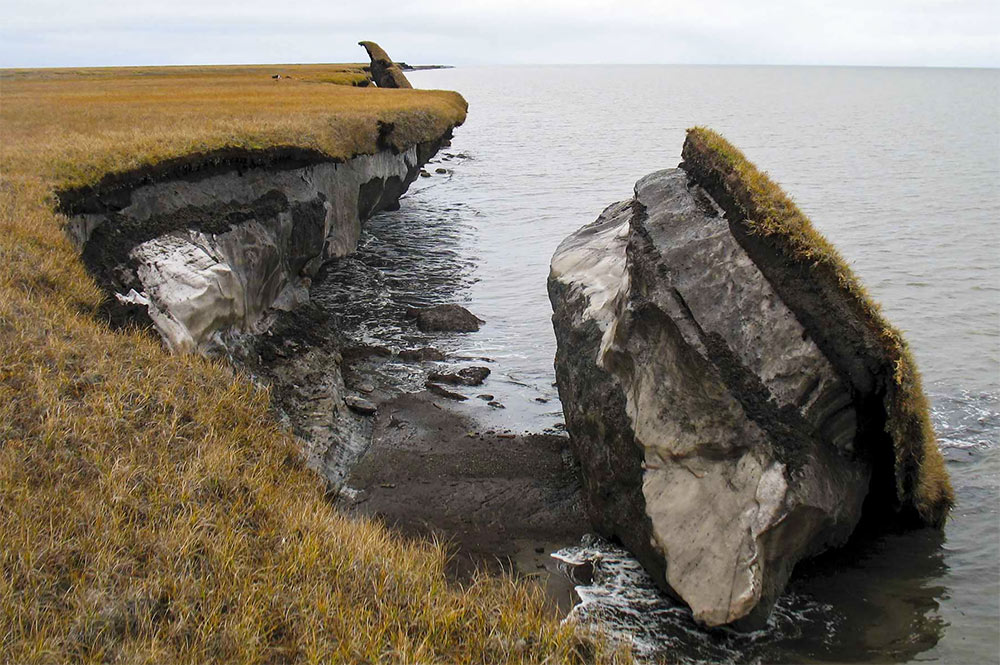
Coastal erosion at Drew Point, Alaska (click to enlarge)
At Drew Point, on the Beaufort coast in the far north of Alaska, the coast is eroding into the ocean at an extremely fast rate. From 2007 to 2016, the coast receded 155 meters (508 feet), which equals to about 17 meters (56 feet) per year. This rapid erosion occurs in a short period of time frame each year because the shoremust be free of sea ice. It is only during these three to four months that waves can form and change the coast. ?

On the change map, a land surface is shown in dark blue as it transitions from land to water, indicating coastal erosion. Zoom in and use the measurement tool to estimate how much coastline has been lost in the last twenty years!
The pop-up video on the map takes you directly to the coast of Drew Point in August 2016 (flight direction from east to west). It was recorded by the NOAA Fisheries Alaska Regional Office as part of the Alaska ShoreZone Mapping project.
On Google Maps, if you switch between map and satellite views, you will notice that the shoreline is about 350 to 450 meters (0.2 to 0.3 miles) further inland on the satellite view than on the map.
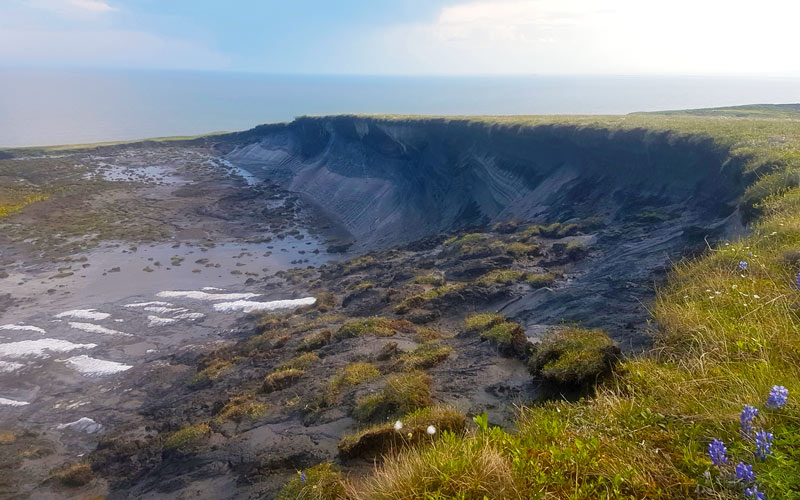
Thaw slump at Qikiqtaruk (Herschel Island), Canada (click to enlarge)
Large retrogressive thaw slumps (RTS) are visible along the coast of Qikiqtaruk (Herschel Island). These spectacular landscapes form when massive ground ice melts in hilly terrain. RTS often form along coastlines where erosion removes the insulating vegetation and soil layer from high, ice-rich cliffs, exposing the ice. As a result, the sun melts the ice and the cliff moves inland – faster than the waves can carry away the remaining thawed soil. Eventually, this soil piles up and insulates the cliff again, or the composition of the cliff changes towards less ice. Then, a retrogressive thaw slump becomes inactive.
On the change map, retrogressive thaw slumps appear in semicircular/circular shapes in blue, yellow, and/or orange colors. Yellow indicates a change to higher soil brightness and increasing greenness, meaning the retrogressive thaw slump is inactive.
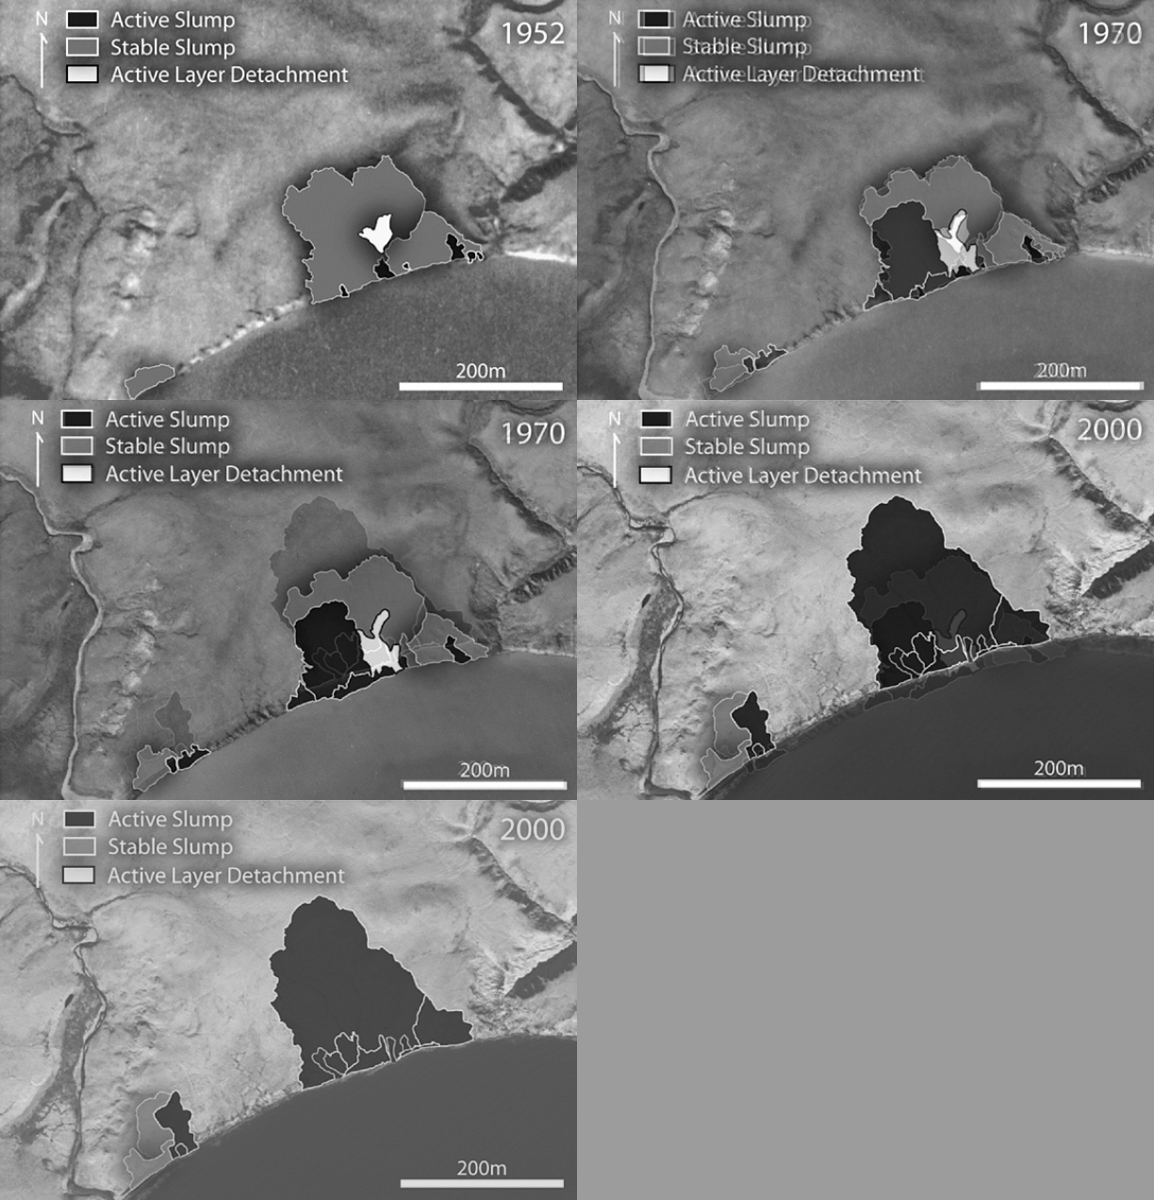
Extent and state of a thaw slump in Thetis Bay, Qikiqtaruk (Herschel Island), in 1952, 1970, and 2000. (click to enlarge)
The three alternating maps show the extent and state of a retrogressive thaw slump in Thetis Bay, Qikiqtaruk (Herschel Island), Canada, in the years 1952, 1970, and 2000. See the marker on the map for location. Look at the change map to see which parts of the retrogressive thaw slump have been particularly active over the last twenty years (blue colors).
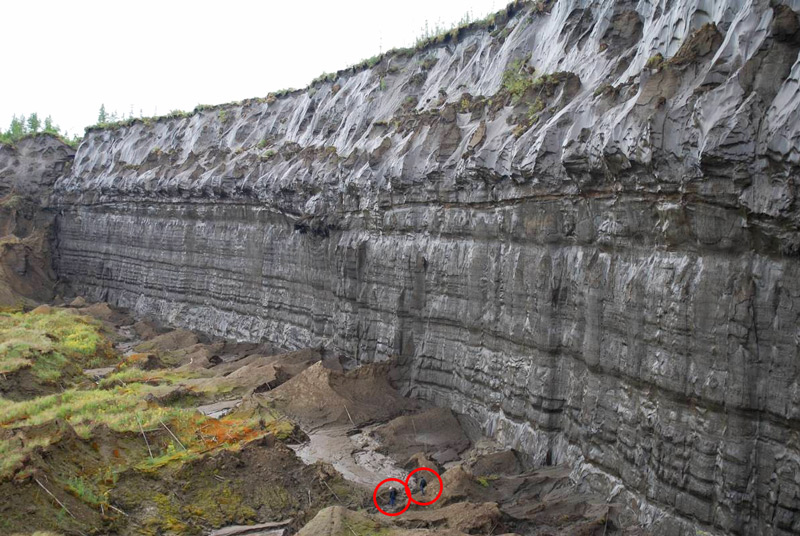
Central headwall (about 55 m high) of the Batagay crater, summer 2017 (click to enlarge)
The Batagay Crater is the largest retrogressive thaw slump known to date. It is located about 10 km southeast of the city of Batagay on the shore of the Batagay River in the center of Verkhoyansk district, Sakha Republic, Russia. The crater has the characteristic semicircular “tadpole” shape of a thaw slump.
On the map you can see the crater as a mixture of blue and yellow. The blue parts are the active zones, which have a higher wetness because of the melting ground. The blue parts are the active zones, which have a higher wetness because of the melting ground. The yellow parts are older parts where the change to bare soil (higher brightness) with initial vegetation (higher greenness) is recorded.
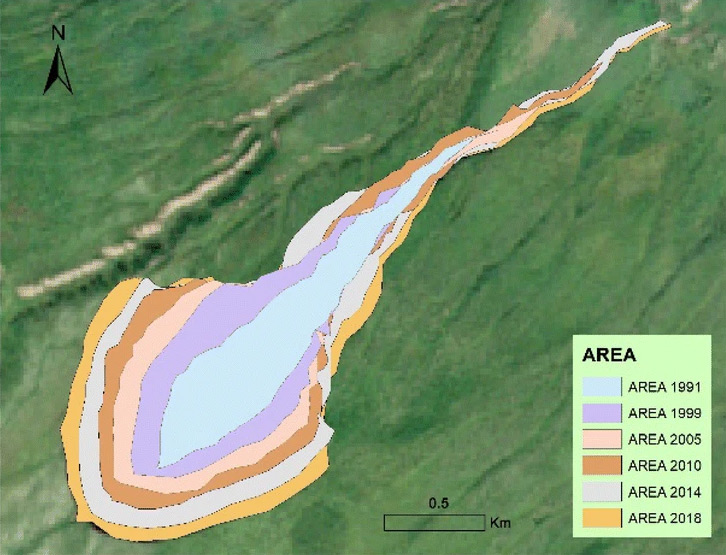
Extent of the Batagay Crater between 1991 and 2018. (click to enlarge)
The Batagay Crater began to form in the 1960s, when deforestation removed the trees that previously cooled the surface by transpiration. The thawing of the permafrost led to a rapid expansion of the crater. The map shows its expansion from 1991 to 2018. ?
Read more about Siberia's ‘gateway to the underworld’ in a news article by Richard Stone, Science.
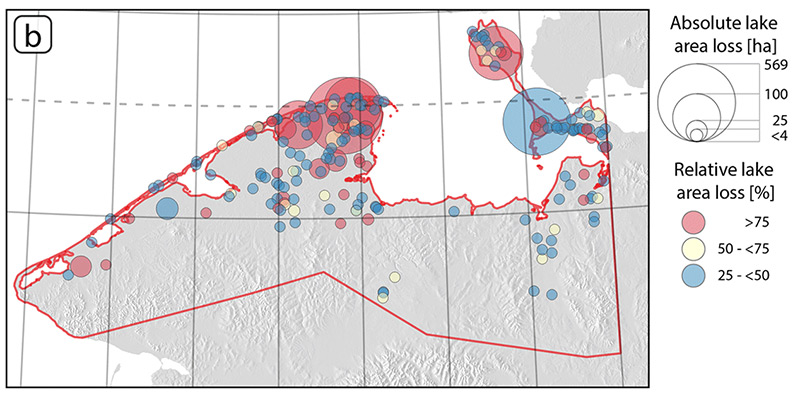
Spatial patterns, size, and percentage of drained lakes in 2017-2018 on the northern Seward Peninsula and Baldwin Peninsula. (click to enlarge)
On the northern Seward Peninsula and the Baldwin Peninsula, many thermokarst lakes have recently been lost due to sudden drainage events. In 2018, lake drainage rates were particularly high in this area, as shown in the figure. This was due to unusually high precipitation and mild, snow-rich winters. ?
Drained lakes are easy to spot on the change map as they appear in bright yellow/orange. This indicates an area with higher soil brightness, increasing greenness and, most importantly, decreasing wetness.
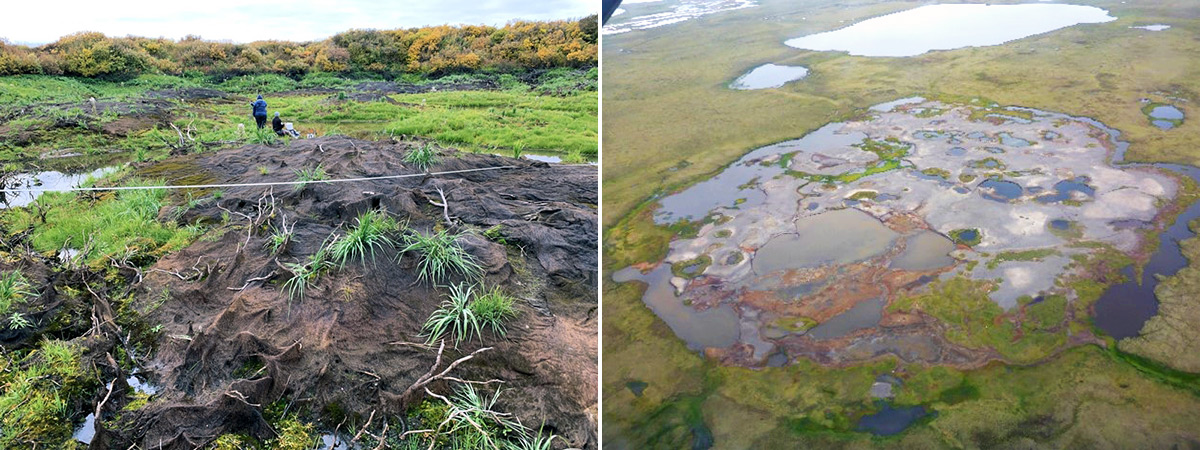
Left: Lake basin near Kotzebue, Baldwin Peninsula, Alaska in September 2023. Right: Freshly drained lake on the northern Seward Peninsula, Alaska in July 2016. (click to enlarge)
The picture shows the bottom of a lake near Kotzebue, Baldwin Peninsula, Alaska. This lake drained on 29 June 2022 (see the marker on the map). Local observer Susan Schaeffer Tessier reported this event to the Local Environmental Observer (LEO) Network, read more about this event here.
For more information on how lakes are shaping Arctic permafrost landscapes, see our Story Map on this topic.
The Anaktuvuk River Fire is known as the largest and longest burning tundra fire in northern Alaska. The fire consumed 100,000 ha during its burn. It was started by a lightning strike on July 16th and burned until early October 2007. The fire was extinguished only when the area was covered by snow. The extreme burn was aided by very high temperatures – the highest in the past 129 years – and a lack of precipitation, which was five times less than normal. ?
On the map you can see the burned area as a long yellow patch, due to the change in burned soil and vegetation (higher brightness) with the growth of initial vegetation (higher greenness) over time.
In the Google Earth Timelapse viewer, press the pause button and navigate to the year 2007. From here, you can see the stages of vegetation regrowth in yearly increments. For a proper viewing experience, please use the Microsoft Edge browser.
You found a mistake, you have a question or an idea how to improve this portal? Your feedback is welcome! Please get in contact with us.
