thermokarst lakes image

Story Map »Thermokarst Lakes«: Introduction

How lakes are shaping Arctic permafrost landscapes

Please note that our Stroy Maps are best viewed on a tablet in landscape mode, laptop, or PC screen!

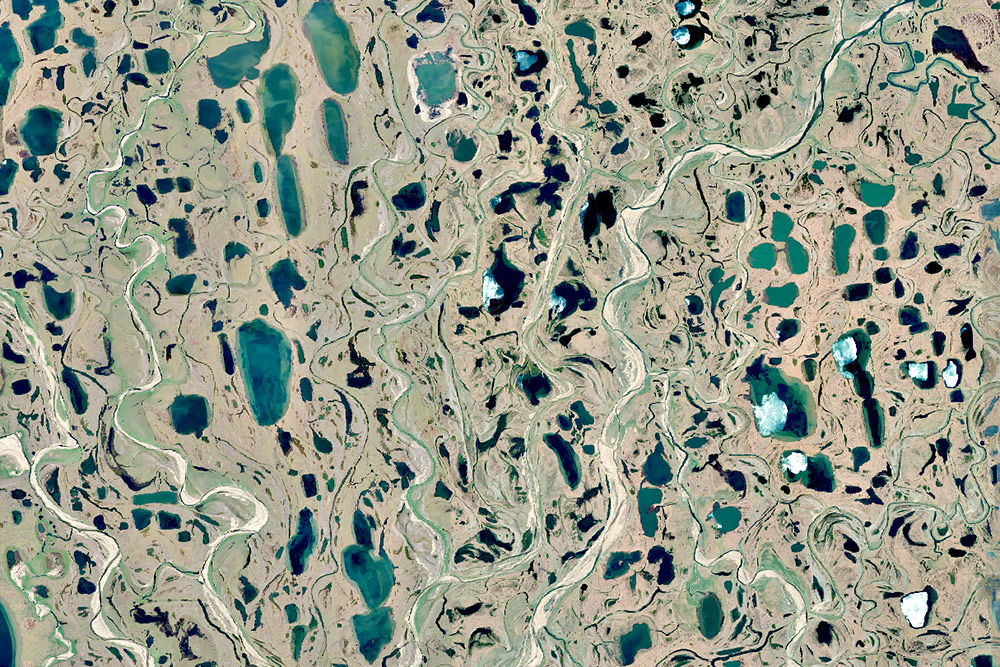
Lakes are a typical feature of Arctic landscapes. Have you ever heard of »thermokarst lakes«, »drunken trees« or »talik« formations under lakes? In this story map you can find out what they are. You will also learn why there are so many lakes in the Arctic, how they form, and why some lakes grow their surface area while others disappear completely.

Lakes are not only abundant in your area. The map zooms in on different locations in the Alaskan, Canadian, and Siberian Arctic to show examples of such lake-dominated areas. Press the pause button to stop the animation. You can use the following buttons to navigate to individual locations:


Definitions

Thermokarst: The process by which characteristic landforms result from the thawing of ice-rich permafrost or the melting of massive ice. (van Everdingen, 1998)

Thermokarst lake: A lake occupying a closed basin formed by settlement of the ground following thawing of ice-rich permafrost or the melting of massive ice. (van Everdingen, 1998)

Story Map »Thermokarst Lakes«: Slide 1

Abundance of lakes

The Arctic has more lakes than anywhere else. According to the Global Lake and Wetland Database, about one quarter of the world's lakes are located in the northern high latitudes. In Figure 1, you can see the total lake area on the horizontal axis, divided into one-degree latitude increments (vertical axis). The peak in lake area in the region between roughly 50° and 70° north cannot be overlooked. This region is also where permafrost is present - the shades of blue indicate the fraction of lakes is found in different permafrost settings in that latitude.

Global Lake Area Distribution

Figure 1: Global lake area distribution (source: see last slide).

How do we know the global distribution of lakes? Satellite images tell us. For example, the European Commission's Joint Research Centre has analyzed more than 4 million Landsat satellite images to detect water bodies and produced a Global Surface Water Dataset. You can view this data on the map by clicking the button below. Visit the Global Surface Water Explorer website to learn more about how water distribution of water changes over time.

Online sources

Global Surface Water Explorer: https://global-surface-water.appspot.com/

Global Lakes and Wetlands Database: https://www.worldwildlife.org/pages/global-lakes-and-wetlands-database

Story Map »Thermokarst Lakes«: Slide 2

Formation of thermokarst lakes

So, is permafrost the reason there are so many lakes in the Arctic? Yes, permafrost plays an important role. Figure 2 explains the process.

As the ground ice in the permafrost begins to melt (a and b), the surface begins to subside and basins form in the formerly flat surface where small ponds are forming (c). Over time, the ground continues to sink in and small ponds unite into a small thermokarst lake that does not freeze to the bottom anymore and maintains liquid water year-round (d). This development leads to more rapid growth and deepening, as the relative warmer water effectively thaws underlying permafrost. Finally, a large lake has grown due to continued sinking and widening (e).

Process of thermokarst lake formation

Figure 2: Process of thermokarst lake formation (source: see last slide).

In areas of continuous permafrost, the formation of a thermokarst lake results in the formation of a permanently thawed zone, a so-called »talik«, under the lake. This is the reason: Typically, a thermokarst lake very effectively takes up heat during the summer and can dissipate it to the underlying permafrost sediments, eventually thawing the ground and resulting in the formation of a talik. Melting ground ice in the underlying permafrost adds to further sinking of the lake bottom and increases the volume of the lake basin.

By the way, the tilting trees shown in Figure 2 are not the result of an artist's imagination. Such »drunken trees« are common in freshly degrading permafrost landscapes due to the destabilization of the terrain surface and soils (see Figure 3).

Drunken trees

Figure 3: »Drunken trees« at a lake shore in July 2015, Brooks Range, Alaska (Photo: Ingmar Nitze).


Can you spot drunken trees in the imagery? As the lake is situated right next to the Dalton Highway, you can also see the trees in Google Street View.

Story Map »Thermokarst Lakes«: Slide 3

Lake growth

Thermokarst lakes continue to grow their surface area over time, as shown in Figure 2. This process is still occurring in all regions where lakes are formed in sediments bound by permafrost.

Several erosional processes occur along the shoreline (Grosse et al., 2013). These include a) the development of thermo-erosional niches, b) thaw slumping and block failure, c) mechanical erosion caused by ice shoving during breakup, and d) the incorporation of polygonal ponds into the lake.

A study of lake dynamics in areas of eastern Canada, Alaska, and eastern and western Siberia found that lake growth increased toward regions with continuous permafrost, but was present in all areas (Nitze et al., 2018). A more local study from the Seward Peninsula in Northwest Alaska determined the shore line shift of thermokarst lakes (Jones et al., 2011). Between 1950/51 and 1978, the nearly 700 surveyed lakes on average expanded by 0.34 m per year and between 1978 and 2006/07 by 0.39 m per year. Figure 4 shows an example of a growing lake and its changing shoreline positions between 1951, 1978, and 2003 from Lake Rhonda on the Seward Peninsula.

Lake Rhonda shore line map (Jones et al., 2011)

Figure 4: Lake Rhonda shore line map (source: see last slide).

The map of Lake Rhonda shows the location of the shoreline for the years 1951 (red), 1978 (green), and 2003 (yellow) with a black and white aerial image from 1951 as background. Reduce the opacity to see a more recent situation on the remotely sensed images.

Change base layer

Use the baselayer switcher at the bottom right of the map to change the background (see screenshot). If you choose to display the change map, you can see that the northern shore of Lake Rhonda has continued to erode over the past 20 years (blue colors), while sediment has been deposited on the southern shore of the lake (yellow colors).

Lake L31

Figure 5: Block failure at Lake L31, North Slope, Alaska (Photo: Ingmar Nitze).

Lake Tes-1

Figure 6: Thaw slumping at Lake Tes-1, North Slope, Alaska (Photo: Ingmar Nitze).

Moving 400 miles (640 kilometers) to the northeast, to the area just north of Teshekpuk Lake near the Arctic Ocean, we find another area where thermokarst lake processes can be seen well. A 2015 photo of the south shore of Lake L31 (Figure 5) clearly shows a large block of soil eroding into the lake. On the eastern shore of Lake Tes-1 (Figure 6), melting ice from the formerly solid permafrost is soaking the ground, eventually leading to sediment transport into the lake.

Zoom in on the locations where the two images were taken:


Switch between change map and satellite images:

Measurement control

In the change map, you can see dark blue edges around the lakeshore - indicating an increase in wetness. You can use the »measure distances« control (see screenshot) to get an idea of how many meters the two lakes have grown over the last 20 years.

Let's look at the area about 30 miles (50 kilometers) south of Teshekpuk Lake. Here we can see on the change map that there has been much less lake growth over the past 20 years. This area is dominated by sandy soils, which contain much less ice than other ice-rich soils. Therefore, the process of lake growth is much less pronounced in this region.

Side note: sand dunes in the Arctic

Pik Sand Dunes

Figure 7: View of the Pik Sand Dunes taken during an AWI flight campaign in July 2015, North Slope, Alaska (Photo: Ingmar Nitze).

Did you notice an area of light blue and orange around four lakes a little further north? If you zoom in here and switch back to the satellite image, you can see dune formations called the Pik Sand Dunes (see Figure 7). For more background on this unlikely tropical resort in the middle of the Arctic, read the article by the National Audubon Society, an American non-profit environmental organization, linked below.

Further reading

Susan C. (2019): A Curious Land Formation in the Western Arctic. Explore the Pik Dunes. National Audubon Society. URL: https://ak.audubon.org/press-release/curious-land-formation-western-arctic

Sources for the »Thermokarst Lakes« Story Map

van Everdingen R.O. (Ed.) (1998): Multi-Language Glossary of Permafrost and Related Ground-Ice Terms, revised May 2005, National Snow and Ice Data Center/World Data Center for Glaciology, Boulder, CO. URL: Link (PDF)

Grosse G., Jones B., and Arp C. (2013): Thermokarst Lakes, Drainage, and Drained Basins. In: John F. Shroder (Editor-in-chief), Giardino, R., and Harbor, J. (Volume Eds.), Treatise on Geomorphology, Vol. 8, Glacial and Periglacial Geomorphology, San Diego, CA, Academic Press: 325–353. DOI: 10.1016/B978-0-12-374739-6.00216-5

Jones B., Grosse G., Arp D.C., Jones M.C., Walter Anthony K.M., and Romanovsky V.E. (2011): Modern thermokarst lake dynamics in the continuous permafrost zone, northern Seward Peninsula, Alaska. Journal of Geophysical Research, 116(G00M03). DOI: 10.1029/2011JG001666

Nitze I., Grosse G., Jones B., Romanovsky V.E., and Bioke J. (2018): Remote sensing quantifies widespread abundance of permafrost region disturbances across the Arctic and Subarctic. Nature Communications, 9(5423). DOI: 10.1038/s41467-018-07663-3

Images

  • Figure 1: Figure 3 (modified) in: Grosse et al. (2013)
  • Figure 2: Figure 7 (modified) in: Grosse et al. (2013)
  • Figure 4: Figure 4 (modified) in: Jones et al. (2011)
  • Title image: Alaska High Resolution (AHR), modified, for a description see data on this website.